Data Science 4 - Plots 3D (like Jaws 3D?)
Now we’re getting into the fun stuff. And by fun I mean complicated. And by complicated I mean cool. And by cool I also mean of limited utility. Limited in a general context. Anyway, Matplotlib can absolutely do 3D plots and that’s what I’d like to talk about. You should definitely check out the data science tag to get the bigger picture. I’ve built up a lot on those to get here.
Table Of Contents
Oh no it isn’t working
Yes, that’s also what I said. This was noodled with using Jupyter Notebook, originally running on a local computer but then migrated to Google Colab. You can grab the notebook from GitHub. The first post goes through that in more detail and I believe that one of the subsequent one explains the Colab part of mounting your Google Drive. Even then, go ahead and run all of the previous cells because they’re setting up objects that we will use for this 3D plot.
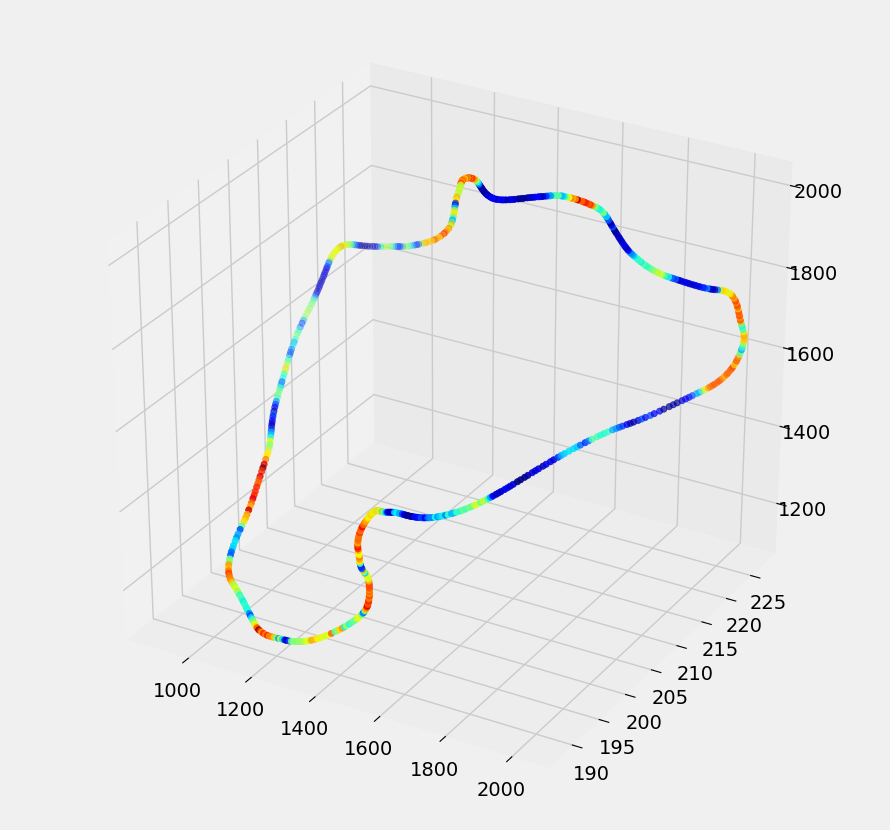
We’ve see at what lap time the acceleration forces are experienced but we haven’t quite seen where on the track they are experienced. And that’s something that I find fascinating. To better accomplish that I’m going to use a 3D plot to actually plot the track and use a colormap (the same colorbar as before, more or less) and normalization to plot the force.
from mpl_toolkits import mplot3d
import matplotlib as mpl
import numpy as np
plt.style.use('fivethirtyeight') # I know I'm making a hash of things
fig = plt.figure(figsize = (10,10))
ax = plt.axes(projection='3d')
cmap = plt.cm.jet
norm = plt.Normalize(vmin=np.min(abs(lap['TotalAcceleration'])), vmax=np.max(abs(lap['TotalAcceleration'])))
ax.scatter(lap['PositionX'], lap['PositionY'], lap['PositionZ'],color=cmap(norm(abs(lap['TotalAcceleration']))))

plt.show()

You'll notice that there is something... off? about this plot. Or you will, in a second, if you didn't already. Because I'll tell you.
The projection='3d' part is, shockingly, what gives us the 3D plot. We pretty much do the same cmap and norm process, and you can adjust them as you like (the ones in the previous post were actually revised by me–I had gone the 3D route first before refining that process). ax.scatter is basically the same but it’s taking 3 positional arguments (x, y, and z as denoted by the field names in the data frame) and a color argument that specifies the normalized colormap values (as you do). Easy. But we get what looks like a track. How is that? Because a line is just a whole mess of points and we’re cheesing it to be able to color the line on a point-by-point basis. It doesn’t look the best but these types of plots don’t seem to be terribly common. I assuming a little Photoshop here would go a long way to making it nicer but, at this point in time, it’s fine for informational purposes.
In the scale of Wrong major
Scales. Draconic? No. Piscine? Absolutely not. Musical. Maybe closer but still wrong. Observe the scale of the axes. The scale of the axes are not equivalent however our data (the x, y, and z positions because it’s 3D) is all in one scale. The scale autoformat doesn’t really account for this and while we’ve used (checking and we have not used) some properties to set the axes to be equal in scale it’s actually more involved in a 3D plot.

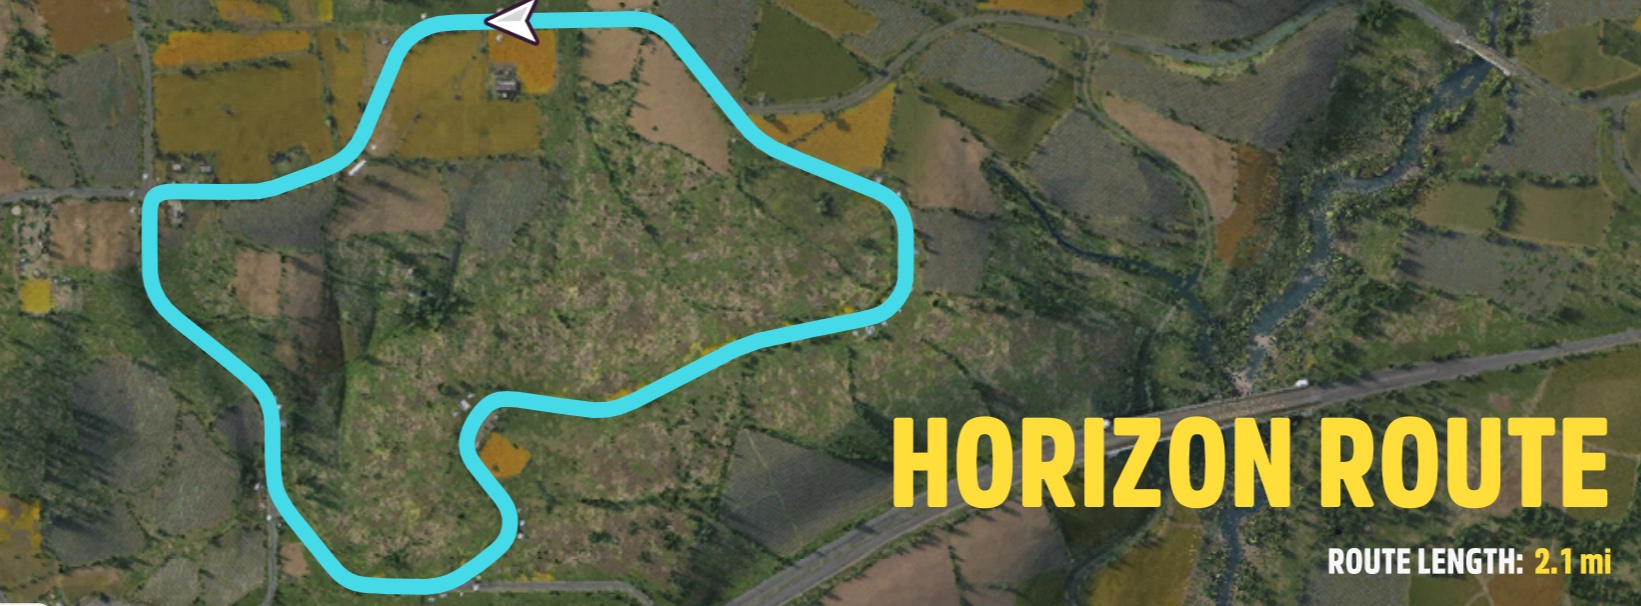
This is actually what the Tierra Prospera track looks like in the game. We should likely try to ensure that ours looks similar.
Square up
There is going to be a lot different from that plot to this one. This was the result of a good amount of research-trial-error-research and I’ll try to link the folks that came through in big ways but it was somewhat frantic and I didn’t keep good notes. If you’re upset about this please reach out and I’ll credit you. The first, and honestly, the most important input was a stack overflow post titled “set matplotlib 3d plot aspect ratio”. John Henckel posted an answer there that worked very well (in my opinion). It was very recent (as of the time of my working on this) and actually worked unlike many of the other proposed functions which didn’t quite work for this case.
If I had to attempt to explain this, I would say that it needs to be called after plotting the data because it’s going to get the axes of the plot and the make them uniform to the largest one in terms of difference. This is the function to make it happen:
def set_aspect_equal(ax):
    """
    Fix the 3D graph to have similar scale on all the axes.
    Call this after you do all the plot3D, but before show
    """
    X = ax.get_xlim3d()
    Y = ax.get_ylim3d()
    Z = ax.get_zlim3d()
    a = [X[1]-X[0],Y[1]-Y[0],Z[1]-Z[0]]
    b = np.amax(a)
    ax.set_xlim3d(X[0]-(b-a[0])/2,X[1]+(b-a[0])/2)
    ax.set_ylim3d(Y[0]-(b-a[1])/2,Y[1]+(b-a[1])/2)
    ax.set_zlim3d(Z[0]-(b-a[2])/2,Z[1]+(b-a[2])/2)
From a certain point of view
The other important thing is to ensure that we’re looking at it from the right place. There’s the concept of a “camera” almost–I’d call it “rotation” of the plot, actually, and I don’t find it straightforward at all however I did eventually settle on ax.view_init(0, -90) where the parameters I believe are elevation and azimuth. In 3D modelling applications the camera metaphor is particularly apt but I’m honestly not convinced that I know how to work an azimuth and elevation system so I cheesed it to get what I wanted.
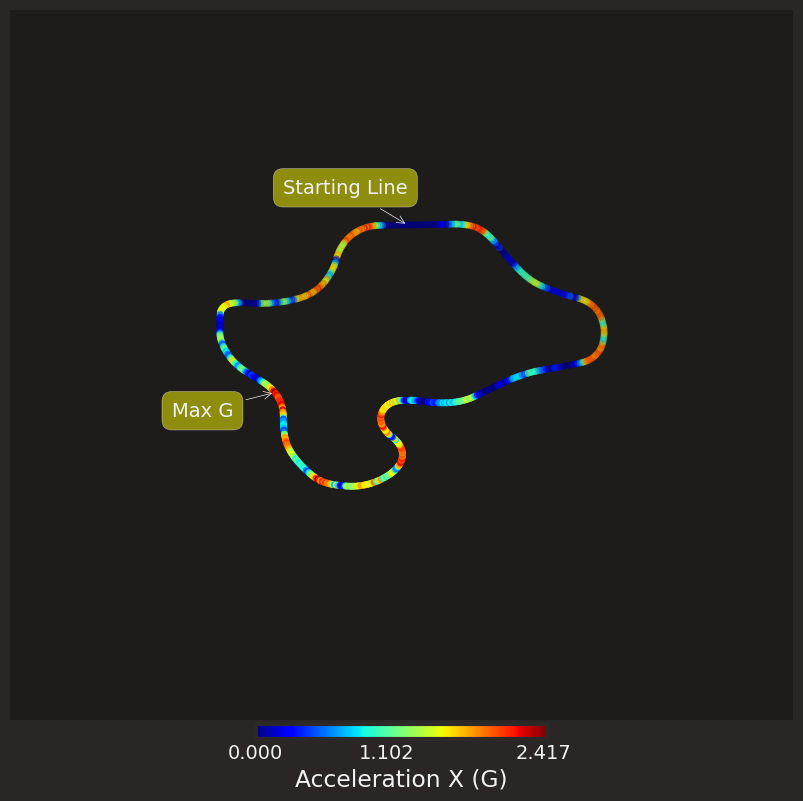
To give it some context I also annotated the starting line and the maximum G event. I feel like that’s helpful and, in the video, the maximum G event was when the car suddenly caught traction after being on the grass for a fraction of a second that gave us that anomalous, and “arcade-like”, 2.5 g measurement. I was able to use pylab.annotate and only use the x and y coordinates because of the ability to proj_transform which, uses the same projection of the plot to drop a 3D point in 2D space.
#%matplotlib notebook
import IPython.display as IPdisplay
import glob
from PIL import Image as PIL_Image
###fast-f1
from matplotlib import cycler
###
from matplotlib.animation import FuncAnimation
#tierra prospera circuit
from mpl_toolkits import mplot3d
import matplotlib as mpl
from mpl_toolkits.mplot3d import proj3d
import pylab
from mpl_toolkits.mplot3d import Axes3D
import numpy as np
### from fast-f1
COLOR_PALETTE = ['#FF79C6', '#50FA7B', '#8BE9FD', '#BD93F9',
                 '#FFB86C', '#FF5555', '#F1FA8C']
plt.rcParams['figure.facecolor'] = '#292625'
plt.rcParams['axes.edgecolor'] = '#2d2928'
plt.rcParams['xtick.color'] = '#f1f2f3'
plt.rcParams['ytick.color'] = '#f1f2f3'
plt.rcParams['axes.labelcolor'] = '#F1f2f3'
plt.rcParams['axes.facecolor'] = '#1e1c1b'
# plt.rcParams['axes.facecolor'] = '#292625'
plt.rcParams['axes.titlesize'] = 'x-large'
# plt.rcParams['font.family'] = 'Gravity'
plt.rcParams['font.weight'] = 'medium'
plt.rcParams['text.color'] = '#F1F1F3'
plt.rcParams['axes.titlesize'] = '19'
plt.rcParams['axes.titlepad'] = '12'
plt.rcParams['axes.titleweight'] = 'light'
plt.rcParams['axes.prop_cycle'] = cycler('color', COLOR_PALETTE)
plt.rcParams['legend.fancybox'] = False
plt.rcParams['legend.facecolor'] = (0.1, 0.1, 0.1, 0.7)
plt.rcParams['legend.edgecolor'] = (0.1, 0.1, 0.1, 0.9)
plt.rcParams['savefig.transparent'] = False
plt.rcParams['axes.axisbelow'] = True
#######
fig = plt.figure(figsize = (9,9))
#norm = plt.Normalize(vmin=0, vmax=np.max(abs(lap['TotalAcceleration'])))
norm = plt.Normalize(vmin=0, vmax=np.max(abs(lap['AccelerationX'] / 9.81)))
ax = plt.axes(projection='3d')
#ax.set_aspect('equal') #does not work for 3d
#ax.set_box_aspect(aspect = (1,1,1))
ax.set_axis_off() #turn off the background and grid and indecies
#cb1=mpl.colorbar.ColorbarBase(ax,cmap=cmap,norm=norm,orientation='horizontal')
#second lap is probably a little less odd than the first
#lap = race_amg_one.loc[(amg_one['Lap'] == 2)]
cmap = plt.cm.jet
#norm = plt.Normalize(vmin=np.min(abs(lap['TotalAcceleration'])), vmax=np.max(abs(lap['TotalAcceleration'])))
#ax.scatter(lap['PositionX'], lap['PositionY'], lap['PositionZ'],color=cmap(norm(abs(lap['TotalAcceleration']))))
ax.scatter(lap['PositionX'], lap['PositionY'], lap['PositionZ'],color=cmap(norm(abs(lap['AccelerationX'] / 9.81))))
#cb1 = mpl.colorbar.ColorbarBase(cbar_ax, cmap=cmap, norm=norm, orientation='horizontal')
print (lap['AccelerationX'].min())
print (lap['AccelerationX'].max())
print (lap['AccelerationX'].mean())
#https://stackoverflow.com/questions/8130823/set-matplotlib-3d-plot-aspect-ratio
def set_aspect_equal(ax):
    """
    Fix the 3D graph to have similar scale on all the axes.
    Call this after you do all the plot3D, but before show
    """
    X = ax.get_xlim3d()
    Y = ax.get_ylim3d()
    Z = ax.get_zlim3d()
    a = [X[1]-X[0],Y[1]-Y[0],Z[1]-Z[0]]
    b = np.amax(a)
    ax.set_xlim3d(X[0]-(b-a[0])/2,X[1]+(b-a[0])/2)
    ax.set_ylim3d(Y[0]-(b-a[1])/2,Y[1]+(b-a[1])/2)
    ax.set_zlim3d(Z[0]-(b-a[2])/2,Z[1]+(b-a[2])/2)
    #ax.set_box_aspect(aspect = (1,1,1))

set_aspect_equal(ax)
ax.view_init(0, -90)
#azimuth -90
#elevation 0fig,ax=plt.subplots(figsize=(6,1))

#lap['TotalAcceleration'] = np.where(DF_test['value'] > threshold, 1,0)

def update(i, fig, ax):
    #ax.view_init(elev=0, azim=i)
    ax.view_init(elev=0, azim=i) #not really possible to do the cool animation I was looking for
    #at least not with this method
    return fig, ax
sm = plt.cm.ScalarMappable(cmap=cmap, norm=norm)
sm.set_array([])

## annotating Max G location because ?? how.
maxg = lap.loc[(lap['AccelerationX'] == lap['AccelerationX'].max())]
maxg_x = maxg['PositionX']
maxg_y = maxg['PositionY']
maxg_z = maxg['PositionZ']
x2, y2, _ = proj3d.proj_transform(maxg_x,maxg_y,maxg_z, ax.get_proj())

label = pylab.annotate(
    "Max G",
    xy = (x2, y2), xytext = (-30, -20),
    textcoords = 'offset points', ha = 'right', va = 'bottom',
    bbox = dict(boxstyle = 'round,pad=0.5', fc = 'yellow', alpha = 0.5),
    arrowprops = dict(arrowstyle = '->', connectionstyle = 'arc3,rad=0', facecolor='white'))
##

## annotating starting line
startingline = lap.loc[(lap['CurrentLapTime'] == lap['CurrentLapTime'].max())]
starting_x = startingline['PositionX']
starting_y = startingline['PositionY']
starting_z = startingline['PositionZ']
x3, y3, _ = proj3d.proj_transform(starting_x,starting_y,starting_z, ax.get_proj())
starting_label = pylab.annotate(
    "Starting Line",
    xy = (x3, y3), xytext = (0, 20),
    textcoords = 'offset points', ha = 'right', va = 'bottom',
    bbox = dict(boxstyle = 'round,pad=0.5', fc = 'yellow', alpha = 0.5),
    arrowprops = dict(arrowstyle = '->', connectionstyle = 'arc3,rad=0', facecolor='red'))

plt.colorbar(sm, ticks=[np.min(abs(lap['AccelerationX']) / 9.81),np.mean(abs(lap['AccelerationX']) / 9.81),np.max(lap['AccelerationX'] / 9.81)],label="Acceleration X (G)",orientation="horizontal",fraction=0.02, pad=0.006)

#anim = FuncAnimation(fig, update, frames=np.arange(0, 270, 2), repeat=False, fargs=(fig, ax))
#anim.save('/home/mark/tierra-prospera-colorbar-animation-cute.gif', dpi=80, writer='imagemagick', fps=24)
plt.show()

It may not be quite perfect, and that would likely be due to the plotting of the track by the car's position versus some overarching structure that is based on the actual road surface which I'm almost certain the game uses, but it's a lot better and can actually be used.
You’ll also notice that there are some specific colors that are set up. These come from fast-f1 which is what inspired me going through all of this. The truth of the matter is that I tried to jump into fast-f1 head first and found that I didn’t know enough about the basics of plotting data in python to get fast-f1 to do my bidding. If you saw that then you’re looking at this immense amount of green text. You’ll also see anim there and that’s actually a functional (but not good) animation that I have quite sorted out just yet. But that’s another interesting thing that you can do with 3D plots.
I don’t exactly recall why I went with AccelerationX on this plot however it’s a trivial exercise to change it as the techniques used in the previous post mostly hold true here. This also holds true with annotating the color bar and all that. With the fast-f1 color scheme it would have actually been beneficial to normalize the jet colormap to have it’s 0 be a cyan. It’s worth noting that anything blue is basically going in a straight line–no steering inputs. That’s a relationship that I’m going to examine in the next post.
./content/posts/data-science-4-plots-3d.md 1:1 suggestion You averaged 1.48 complex marktoso.Kiss words per sentence 9:5 warning Try to avoid using Microsoft.We first-person plural like 'we'. 9:49 warning Use first person (such as ' I Microsoft.FirstPerson ') sparingly. 9:88 warning Use first person (such as ' I Microsoft.FirstPerson ') sparingly. 9:113 warning Use first person (such as ' I Microsoft.FirstPerson ') sparingly. 14:22 warning Use first person (such as ' I Microsoft.FirstPerson ') sparingly. 14:36 suggestion 'was noodled' looks like Microsoft.Passive passive voice. 14:298 suggestion Try to keep sentences short (< Microsoft.SentenceLength 30 words). 14:398 warning Use first person (such as ' I Microsoft.FirstPerson ') sparingly. 14:425 suggestion Consider using 'later' Microsoft.ComplexWords or 'next' instead of 'subsequent'. 14:523 warning Consider using 'all' instead Microsoft.Wordiness of 'all of'. 14:534 suggestion Consider using 'earlier' Microsoft.ComplexWords instead of 'previous'. 14:589 warning Try to avoid using Microsoft.We first-person plural like 'we'. 16:1 warning Try to avoid using Microsoft.We first-person plural like 'We'. 16:54 suggestion 'are experienced' looks like Microsoft.Passive passive voice. 16:74 warning Try to avoid using Microsoft.We first-person plural like 'we'. 16:117 error Use 'they're' instead of 'they Microsoft.Contractions are'. 16:122 suggestion 'are experienced' looks like Microsoft.Passive passive voice. 16:164 warning Use first person (such as ' I Microsoft.FirstPerson ') sparingly. 16:185 suggestion Try to keep sentences short (< Microsoft.SentenceLength 30 words). 16:195 suggestion Consider using 'carry out' or Microsoft.ComplexWords 'do' instead of 'accomplish'. 16:211 warning Use first person (such as Microsoft.FirstPerson 'I'm') sparingly. 30:103 warning In general, don't use an Microsoft.Ellipses ellipsis. 32:28 suggestion Try to keep sentences short (< Microsoft.SentenceLength 30 words). 32:55 warning Try to avoid using Microsoft.We first-person plural like 'us'. 32:71 suggestion Try to keep sentences short (< Microsoft.SentenceLength 30 words). 32:71 warning Try to avoid using Microsoft.We first-person plural like 'We'. 32:178 suggestion Consider using 'earlier' Microsoft.ComplexWords instead of 'previous'. 32:217 warning Use first person (such as Microsoft.FirstPerson 'me') sparingly. 32:510 warning Try to avoid using Microsoft.We first-person plural like 'we'. 32:542 error Use 'how's' instead of 'How Microsoft.Contractions is'. 32:746 warning Consider removing 'terribly'. Microsoft.Adverbs 32:762 warning Use first person (such as ' I Microsoft.FirstPerson ') sparingly. 32:842 warning Consider using 'at this point' Microsoft.Wordiness instead of 'at this point in time'. 35:118 suggestion Try to keep sentences short (< Microsoft.SentenceLength 30 words). 35:140 error Use 'aren't' instead of 'are Microsoft.Contractions not'. 35:148 suggestion Consider using 'equal' instead Microsoft.ComplexWords of 'equivalent'. 35:167 warning Try to avoid using Microsoft.We first-person plural like 'our'. 35:270 warning Consider removing 'really'. Microsoft.Adverbs 35:304 warning Try to avoid using Microsoft.We first-person plural like 'we'. 35:329 error Use 'we've' instead of 'we Microsoft.Contractions have'. 37:146 warning Try to avoid using Microsoft.We first-person plural like 'We'. 37:170 suggestion Verify your use of 'ensure' Microsoft.Vocab with the A-Z word list. 37:182 warning Try to avoid using Microsoft.We first-person plural like 'ours'. 40:1 error Punctuation should be inside Microsoft.Quotes the quotes. 40:66 suggestion Try to keep sentences short (< Microsoft.SentenceLength 30 words). 40:228 warning Use first person (such as ' I Microsoft.FirstPerson ') sparingly. 40:335 warning Consider removing 'honestly'. Microsoft.Adverbs 40:631 warning Consider removing 'very'. Microsoft.Adverbs 40:645 warning Use first person (such as Microsoft.FirstPerson 'my') sparingly. 40:658 suggestion Try to keep sentences short (< Microsoft.SentenceLength 30 words). 40:665 warning Consider removing 'very'. Microsoft.Adverbs 40:696 warning Use first person (such as Microsoft.FirstPerson 'my') sparingly. 42:1 suggestion Try to keep sentences short (< Microsoft.SentenceLength 30 words). 42:3 warning Use first person (such as ' I Microsoft.FirstPerson ') sparingly. 42:13 suggestion Consider using 'try' instead Microsoft.ComplexWords of 'attempt'. 42:37 warning Use first person (such as ' I Microsoft.FirstPerson ') sparingly. 42:67 suggestion 'be called' looks like passive Microsoft.Passive voice. 60:33 suggestion Verify your use of 'ensure' Microsoft.Vocab with the A-Z word list. 60:45 warning Try to avoid using Microsoft.We first-person plural like 'we'. 60:87 suggestion Try to keep sentences short (< Microsoft.SentenceLength 30 words). 60:99 suggestion Consider using 'idea' instead Microsoft.ComplexWords of 'concept'. 60:178 warning Use first person (such as ' I Microsoft.FirstPerson ') sparingly. 60:225 warning Use first person (such as ' I Microsoft.FirstPerson ') sparingly. 60:296 warning Use first person (such as ' I Microsoft.FirstPerson ') sparingly. 60:338 suggestion Try to keep sentences short (< Microsoft.SentenceLength 30 words). 60:411 warning Use first person (such as Microsoft.FirstPerson 'I'm') sparingly. 60:415 warning Consider removing 'honestly'. Microsoft.Adverbs 60:442 warning Use first person (such as ' I Microsoft.FirstPerson ') sparingly. 60:496 warning Use first person (such as ' I Microsoft.FirstPerson ') sparingly. 60:521 warning Use first person (such as ' I Microsoft.FirstPerson ') sparingly. 62:24 warning Use first person (such as ' I Microsoft.FirstPerson ') sparingly. 62:25 suggestion Try to keep sentences short (< Microsoft.SentenceLength 30 words). 62:84 warning Use first person (such as ' I Microsoft.FirstPerson ') sparingly. 62:85 suggestion Try to keep sentences short (< Microsoft.SentenceLength 30 words). 62:115 error More than 3 commas! marktoso.TresComas 62:168 warning Consider removing 'suddenly'. Microsoft.Adverbs 62:255 warning Try to avoid using Microsoft.We first-person plural like 'us'. 62:278 error Punctuation should be inside Microsoft.Quotes the quotes. 62:311 warning Use first person (such as ' I Microsoft.FirstPerson ') sparingly. 188:5 suggestion Try to keep sentences short (< Microsoft.SentenceLength 30 words). 188:209 error Use 'that's' instead of 'that Microsoft.Contractions is'. 188:214 suggestion 'is based' looks like passive Microsoft.Passive voice. 188:256 warning Use first person (such as Microsoft.FirstPerson 'I'm') sparingly. 188:329 suggestion 'be used' looks like passive Microsoft.Passive voice. 190:61 suggestion 'are set' looks like passive Microsoft.Passive voice. 190:160 warning Use first person (such as Microsoft.FirstPerson 'me') sparingly. 190:177 warning Consider using 'all' instead Microsoft.Wordiness of 'all of'. 190:190 suggestion Try to keep sentences short (< Microsoft.SentenceLength 30 words). 190:221 warning Use first person (such as ' I Microsoft.FirstPerson ') sparingly. 190:276 warning Use first person (such as ' I Microsoft.FirstPerson ') sparingly. 190:363 warning Use first person (such as Microsoft.FirstPerson 'my') sparingly. 190:540 warning Use first person (such as ' I Microsoft.FirstPerson ') sparingly. 192:1 suggestion Try to keep sentences short (< Microsoft.SentenceLength 30 words). 192:1 warning Use first person (such as 'I Microsoft.FirstPerson ') sparingly. 192:27 warning Use first person (such as ' I Microsoft.FirstPerson ') sparingly. 192:144 suggestion Consider using 'earlier' Microsoft.ComplexWords instead of 'previous'. 192:496 warning Use first person (such as Microsoft.FirstPerson 'I'm') sparingly. 194:40 suggestion 'was checked' looks like Microsoft.Passive passive voice. 194:146 suggestion 'was checked' looks like Microsoft.Passive passive voice. 194:184 suggestion Verify your use of 'as well Microsoft.Vocab as' with the A-Z word list. 194:210 warning Use first person (such as ' I Microsoft.FirstPerson ') sparingly. 194:284 suggestion 'was put' looks like passive Microsoft.Passive voice.✖ 8 errors, 58 warnings and 37 suggestions in 1 file.