Data Science 2: Forza Boogaloo
You’ve read part one of this series and you’ve… well that’s the only prerequisite, really. As before, there are many concepts involved and I’m not even familiar with all of them however I will introduce them as they become relevant.
Table Of Contents
Video killed the Forza Horizon star
Again, these posts are not a flex of my skills. I don’t think I’m particularly good however I have no qualms using data from my race for the purposes of analysis. I took another capture with associated video.
import pandas as pd
from matplotlib import pyplot as plt
from matplotlib.pyplot import figure

# read csv file
ford_falcon = pd.read_csv('/content/drive/MyDrive/ForzaData/ford_falcon_video.csv')
And you can get falcon_video.csv right here. The video is here in case you’re interested:
146 825 854. You’ll note that I have the telemetry display up and set to the accelerometer. The numbers are interesting here so let’s just run a plot on only the second lap to see where we’re at.import pandas as pd
from matplotlib import pyplot as plt
from matplotlib.pyplot import figure
import matplotlib.ticker as tick
WELCOME_TO_EARTH = 9.80665
# read csv file
ford_falcon = pd.read_csv('/content/drive/MyDrive/ForzaData/ford_falcon_video.csv')
race_falcon = ford_falcon.loc[(ford_falcon['IsRaceOn'] == 1)]
lap = race_falcon.loc[(race_falcon['Lap'] == 2)]
plt.style.use('default')
fig, ax = plt.subplots()
ax.plot(lap['CurrentLapTime'],lap['AccelerationX'] / WELCOME_TO_EARTH, color="orange", label="Ford Falcon FPV")
ax.set_xlabel("Race Time (M:S)")
ax.set_ylabel("Acceleration X (g)")
def racetime_fmt(x, y):
minutes, seconds = divmod(x, 60)
return "{:.0f}".format(minutes) + ':' + "{:.0f}".format(seconds)
ax.xaxis.set_major_formatter(tick.FuncFormatter(racetime_fmt))
ax.legend()
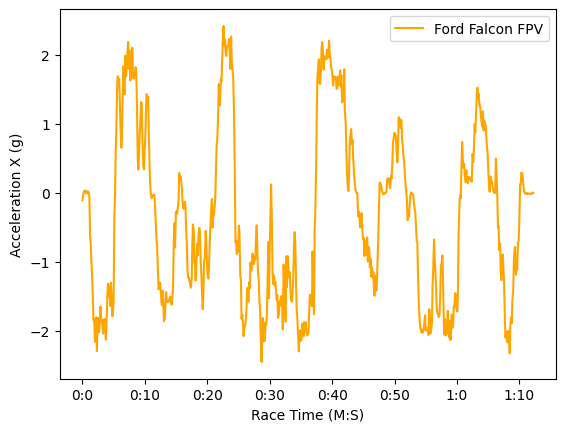
The second lap in the video above. We're using a `loc` with `Lap == 2` to pull specifically the second lap from the telemetry.
As you see, there have been some changes.
Style, profile
There’s an interesting line in there, plt.style.use is where you can access the stylesheets available in matplotlib. I’m pretty OK with default and I’ll be sticking with it for a while however you can absolutely check out a full gallery of style sheets and roll with what works for you. The color for the Ford Falcon is specifically set to orange because the car is orange. No science there but stylesheets will have their own color selection orders and things like that which could make life easier when preparing a number of graphics. The “magic number” of 9.81 also disappeared with a preference for the more precise variable WELCOME_TO_EARTH.
Subplots of plots
One thing that I didn’t touch upon in the first part was the subplots() method. There is a concept of subplots in matplotlib that can accomplish various things. This post is digging into the concept presently however it’s worthwhile to note that many examples of matplotlib do not use the subplots method and many others, like this one, use it gratuitously (so far).
import pandas as pd
from matplotlib import pyplot as plt
from matplotlib.pyplot import figure
import matplotlib.ticker as tick
WELCOME_TO_EARTH = 9.80665
# read csv file
ford_falcon = pd.read_csv('/content/drive/MyDrive/ForzaData/ford_falcon_video.csv')
race_falcon = ford_falcon.loc[(ford_falcon['IsRaceOn'] == 1)]
lap = race_falcon.loc[(race_falcon['Lap'] == 2)]
plt.style.use('default')
fig, (ax, ax2)= plt.subplots(2,1)
## first figure
ax.set_title("Acceleration along the X axis")
ax.plot(lap['CurrentLapTime'],lap['AccelerationX'] / WELCOME_TO_EARTH, color="orange", label="Ford Falcon FPV")
ax.set_xlabel("Race Time (M:S)")
ax.set_ylabel("Acceleration X (g)")

def racetime_fmt(x, y):
    minutes, seconds = divmod(x, 60)
    return "{:.0f}".format(minutes) + ':' + "{:.0f}".format(seconds)

ax.xaxis.set_major_formatter(tick.FuncFormatter(racetime_fmt))

## second figure
ax2.set_title("Acceleration along the Y axis")
ax2.plot(lap['CurrentLapTime'],lap['AccelerationY'] / WELCOME_TO_EARTH, color="blue", label="Ford Falcon FPV")
ax2.set_xlabel("Race Time (M:S)")
ax2.set_ylabel("Acceleration Y (g)")

ax2.xaxis.set_major_formatter(tick.FuncFormatter(racetime_fmt))

ax.legend()
ax2.legend()
fig.subplots_adjust(hspace=0.75)
fig.suptitle("Acceleration of the Ford Falcon FPV")
fig.show()
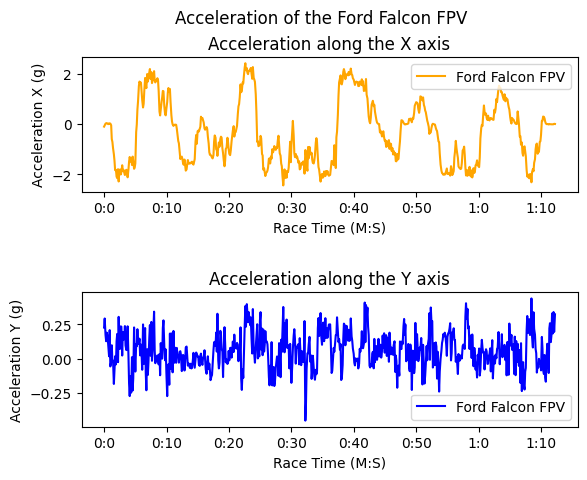
Using subplots you can put two graphs in the same image file.
subplots() returns multiple values as you have seen however that second value can also be multiple values. Pythonic as all get out. You can also do this with a number that will just return an array but, for clarity of examples, I’m going to be using named variables. I’m also at no point passing it an unknown amount of plots that I’d like to make as it would somewhat defeat the point of creating plots with relationships to be analyzed. subplots(2,1) in this case is going to make two rows and one column.
Axes, bold as love
The reason that the convention for a subplot to be called ax is that they’re considered to be axes. Plural of axis, to my knowledge, but I’m actually not terribly interested in the reason why and more pleased with the ability to use a Jimi Hendrix reference. fig is the overarching figure object and the second parameter can be a number of axes enclosed in parenthesis (they should match the number of cells that will end up being created–I ran into some issues there at one point but I can’t recall exactly what the parameters for error were). At this point ax and ax2 exist and represent the two different graphs in the overall figure. You can see that for ax2 all of the same things can be set as they are on ax and this can be completely different data if that’s what is chosen to be displayed. As to why I chose acceleration on x and y, well there is method to this madness. The figure can also have a suptitle which is, quite literally, a super title.
legend() of the Hidden Temple
Note that both axes have a call to legend() right at the end. That shows the, yes, legend that identifies the line. We set that text as label on the plot() function call. It’s also extremely Pythonic to have some positional parameters and then just pass others as parameter=value. Pretty wild but it works. Just be aware that you can’t always freestyle those. I’ll admit that I am quite the fan of a legend on a graph but, in this case, it’s been quite gratuitous. Why would we need a legend when we only have the one car’s acceleration being plotted. Can’t they be plotted on the same graph as two separate lines since they share units of measure on the axes? Yes, yes they can.
import pandas as pd
from matplotlib import pyplot as plt
from matplotlib.pyplot import figure
import matplotlib.ticker as tick
WELCOME_TO_EARTH = 9.80665
# read csv file
ford_falcon = pd.read_csv('/content/drive/MyDrive/ForzaData/ford_falcon_video.csv')
race_falcon = ford_falcon.loc[(ford_falcon['IsRaceOn'] == 1)]
lap = race_falcon.loc[(race_falcon['Lap'] == 2)]
plt.style.use('default')
fig, ax = plt.subplots()
## first figure
#ax.set_title("Acceleration along the X axis")
ax.plot(lap['CurrentLapTime'],lap['AccelerationX'] / WELCOME_TO_EARTH, color="orange", label="Acceleration X")
ax.plot(lap['CurrentLapTime'],lap['AccelerationY'] / WELCOME_TO_EARTH, color="blue", label="Acceleration Y")
ax.set_xlabel("Race Time (M:S)")
ax.set_ylabel("Acceleration X (g)")

def racetime_fmt(x, y):
    minutes, seconds = divmod(x, 60)
    return "{:.0f}".format(minutes) + ':' + "{:.0f}".format(seconds)

ax.xaxis.set_major_formatter(tick.FuncFormatter(racetime_fmt))
ax.legend()

fig.subplots_adjust(hspace=0.75)
fig.suptitle("Acceleration of the Ford Falcon FPV")
fig.show()
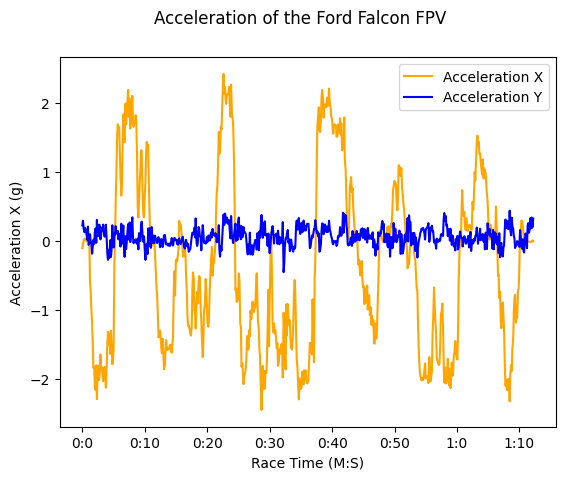
You can absolutely plot two lines on the same graph (when that makes sense, don't be silly).
Now that legend is really paying off, eh? The Orange Iguanas and the Blue Barracudas teamed up on the same plane makes a graph look cooler and definitely more interesting. There is further meaning to be imparted. Also, the color selections. Again, the style sheet will pick different colors for each line so they don’t need to be specifically called out. But we’re losing a little bit of resolution on the “Acceleration Y” line as the scale for X is much larger. We can do something like point out where the maximum values are and what they are.
Congratulations, now we’re going to make some annotations
This isn’t always necessary in a plot or a graph however it’s sometimes crucial to add some further concrete information to communicate meaning and give some perspective. As a gimmick let’s point out where the highest values are. Matplotlib has annotations which can do just that.
import pandas as pd
from matplotlib import pyplot as plt
from matplotlib.pyplot import figure
import matplotlib.ticker as tick

WELCOME_TO_EARTH = 9.80665
# read csv file
ford_falcon = pd.read_csv('/content/drive/MyDrive/ForzaData/ford_falcon_video.csv')
race_falcon = ford_falcon.loc[(ford_falcon['IsRaceOn'] == 1)]
lap = race_falcon.loc[(race_falcon['Lap'] == 2)]
plt.style.use('default')
fig, ax = plt.subplots()
## first figure
#ax.set_title("Acceleration along the X axis")
ax.plot(lap['CurrentLapTime'],lap['AccelerationX'] / WELCOME_TO_EARTH, color="orange", label="Acceleration X")
ax.plot(lap['CurrentLapTime'],lap['AccelerationY'] / WELCOME_TO_EARTH, color="blue", label="Acceleration Y")
ax.set_xlabel("Race Time (M:S)")
ax.set_ylabel("Acceleration X (g)")


time_max_g_x = lap.loc[(abs(lap['AccelerationX']) == abs(lap['AccelerationX']).max())]
#print(time_max_g_x)
x_note_x = time_max_g_x['CurrentLapTime']
#print(x_note_x)
x_note_y = time_max_g_x['AccelerationX'].mean() / WELCOME_TO_EARTH #i don't know why this doesnt' convert to a value on its own
#print(x_note_y)

time_max_g_y = lap.loc[(abs(lap['AccelerationY']) == abs(lap['AccelerationY']).max())]
y_note_x = time_max_g_y['CurrentLapTime']
y_note_y = time_max_g_y['AccelerationY'].mean() / WELCOME_TO_EARTH

## annotation for max G X
ax.annotate("{:.2f} g".format(x_note_y),
            xy=(x_note_x - .1, x_note_y), xycoords='data',
            xytext=(-20, -5), textcoords='offset points',
            bbox = dict(boxstyle = 'round,pad=0.1', fc = 'orange', alpha = 0.5),
            arrowprops = dict(arrowstyle = '->', connectionstyle = 'arc3,rad=0'),
            horizontalalignment='right', verticalalignment='bottom')

## annotation for max G Y
ax.annotate("{:.2f} g".format(y_note_y),
            xy=(y_note_x, y_note_y), xycoords='data',
            xytext=(-20, -5), textcoords='offset points',
            bbox = dict(boxstyle = 'round,pad=0.1', fc = 'blue', alpha = 0.5),
            arrowprops = dict(arrowstyle = '->', connectionstyle = 'arc3,rad=0'),
            horizontalalignment='right', verticalalignment='bottom')

def racetime_fmt(x, y):
    minutes, seconds = divmod(x, 60)
    return "{:.0f}".format(minutes) + ':' + "{:.0f}".format(seconds)

ax.xaxis.set_major_formatter(tick.FuncFormatter(racetime_fmt))
ax.legend()

fig.subplots_adjust(hspace=0.75)
fig.suptitle("Acceleration of the Ford Falcon FPV")
fig.show()
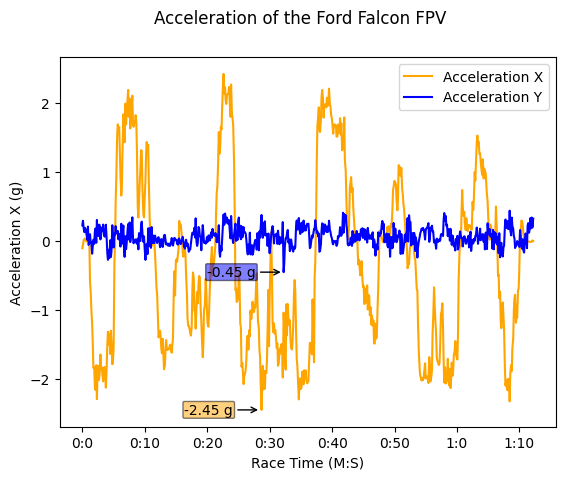
Annotations like these can be useful depending on the context. Sometimes things like peak values can deliver peak value to your visualization.
You’ll notice the use of abs to get absolute values. This is important, again, because acceleration is a vector. The sign of the number is the directionality. When watching the video you’ll see that the values in the accelerometer circle are always positive values. Those values are the magnitude of the combined vectors of AccelerationX and AccelerationY.
I ran into something odd (at least to me it’s odd) where time_max_g_x and time_max_g_y both failed to have their acceleration values be a single value. They were being passed through as a series (even though CurrentLapTime was not) so I just grabbed the average–can’t mess it up too bad if you use an average–even though the values matched the min() or max() values.
We call .annotate() on the axes that we wish to annotate (in this case just the one) and there are a whole mess of parameters in here–many with parameters of their own. First off is the string that will be our text and again we use that string formatting trick to display a reasonable number. xy is the X and Y values of your annotation and there can be some variability to this but xycoords=data tells the annotation to use the coordinates that we are plotting our data on. This makes reasonable sense here. We do a tiny bit of arithmetic to move the point of the arrow just off the point in question. textcoords assigns the relationship of the coordinates for the text to the coordinates xy–“offset points” means that xytext is the offset from that point versus being absolute or a data coordinate or something. bbox is the little box around the text and has it’s own set of properties in there that are interesting–feel free to mess with those. Same with arrowprops.
Magnitude: Pop, pop!
This plot is cute and all but it isn’t relating to what we’re seeing in the video. That always positive number is the magnitude of the two vectors (acceleration x and acceleration y) and that’s just the distance from (0,0). We can readily compute the magnitude and add it to our dataframe. Cool, right? No? I guess it’s just me, then, huh?
import pandas as pd
from matplotlib import pyplot as plt
from matplotlib.pyplot import figure
import matplotlib.ticker as tick
import numpy as np # new import

WELCOME_TO_EARTH = 9.80665
# read csv file
ford_falcon = pd.read_csv('/content/drive/MyDrive/ForzaData/ford_falcon_video.csv')
race_falcon = ford_falcon.loc[(ford_falcon['IsRaceOn'] == 1)]
lap = race_falcon.loc[(race_falcon['Lap'] == 2)]

## Add total acceleration to dataframe
#lap['TotalAcceleration'] = np.sqrt(pow(lap['AccelerationX'],2) + pow(lap['AccelerationY'],2) + pow(lap['AccelerationZ'],2))/ 9.81
lap = lap.assign(TotalAcceleration=lambda x: np.sqrt(pow(x['AccelerationX'],2) + pow(x['AccelerationY'],2))/ WELCOME_TO_EARTH)
plt.style.use('default')
fig, ax = plt.subplots()

ax.plot(lap['CurrentLapTime'],lap['TotalAcceleration'], color="orange", label="Acceleration X + Y")

ax.set_xlabel("Race Time (M:S)")
ax.set_ylabel("Acceleration X (g)")


time_max_g = lap.loc[(abs(lap['TotalAcceleration']) == abs(lap['TotalAcceleration']).max())]
#print(time_max_g_x)
total_note_x = time_max_g['CurrentLapTime']
#print(x_note_x)
total_note_y = time_max_g['TotalAcceleration'].mean() #i don't know why this doesnt' convert to a value on its own
#print(x_note_y)


## annotation for max G X
ax.annotate("{:.2f} g".format(total_note_y),
            xy=(total_note_x - .1, total_note_y), xycoords='data',
            xytext=(-20, -5), textcoords='offset points',
            bbox = dict(boxstyle = 'round,pad=0.1', fc = 'orange', alpha = 0.5),
            arrowprops = dict(arrowstyle = '->', connectionstyle = 'arc3,rad=0'),
            horizontalalignment='right', verticalalignment='bottom')


def racetime_fmt(x, y):
    minutes, seconds = divmod(x, 60)
    return "{:.0f}".format(minutes) + ':' + "{:.0f}".format(seconds)

ax.xaxis.set_major_formatter(tick.FuncFormatter(racetime_fmt))
ax.legend()

fig.subplots_adjust(hspace=0.75)
fig.suptitle("Total Acceleration of the Ford Falcon FPV")
fig.show()
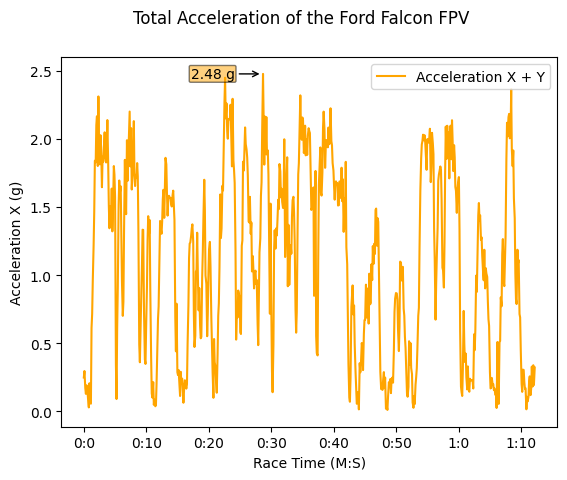
Annotated graph of the magnitude of acceleration along the X and Y axes similar to that of the accelerometer in the video.
lambda is doing the heavy lift here. I’m honestly unsure why it’s called a lambda function but it’s basically operating on this where this is an object-oriented concept. It’s also iterating through the list. It’s very pithy. Not even a line of code to go through all the data and perform that operation. I’ll look that up eventually. Either way, that’s the recommended way to add a column to a dataframe and the important part is TotalAcceleration = lambda: x. You can also apply operations to all of the Acceleration columns to turn them in g units right now (but we won’t). TotalAcceleration is already in g, however, and mixing units is not advisable but we’ve gone too far. The great part of this is that the rest of the plot remains mostly unchanged. The notation code is potentially generic enough that it can be refactored out into a function with optional overrides for the location and color of the box.
Message
There’s a lot that you can do here but it isn’t always just about the plotting and the programming but the intersection of that with the information. We’ve adjusted and altered our plots a few times to get to a/my goal of visualizing this information. I’m primarily concerned with understanding the magnitude of the forces. How we present that is important in terms of communicating something specific. There are yet more ways to go about it and we will indeed go about it on some other ways in the next post.
./content/posts/data-science-2-forza-boogaloo.md 1:1 suggestion Try to keep the Flesch-Kincaid marktoso.Readability grade level (8.14) below 8. 1:1 suggestion You averaged 1.61 complex marktoso.Kiss words per sentence 9:95 warning In general, don't use an Microsoft.Ellipses ellipsis. 9:134 warning Consider removing 'really'. Microsoft.Adverbs 9:192 warning Use first person (such as Microsoft.FirstPerson 'I'm') sparingly. 9:219 warning Consider using 'all' instead Microsoft.Wordiness of 'all of'. 9:238 warning Use first person (such as ' I Microsoft.FirstPerson ') sparingly. 13:4 suggestion 'Video killed the Forza Microsoft.Headings Horizon star' should use sentence-style capitalization. 14:1 error Use 'aren't' instead of 'are Microsoft.Contractions not'. 14:40 warning Use first person (such as Microsoft.FirstPerson 'my') sparingly. 14:65 warning Use first person (such as Microsoft.FirstPerson 'I'm') sparingly. 14:94 warning Use first person (such as ' I Microsoft.FirstPerson ') sparingly. 14:128 warning Use first person (such as Microsoft.FirstPerson 'my') sparingly. 14:165 warning Use first person (such as ' I Microsoft.FirstPerson ') sparingly. 26:109 warning Use first person (such as ' I Microsoft.FirstPerson ') sparingly. 26:208 warning Try to avoid using Microsoft.We first-person plural like 'let's'. 26:266 warning Try to avoid using Microsoft.We first-person plural like 'we'. 51:104 suggestion Verify your use of 'above' Microsoft.Vocab with the A-Z word list. 51:111 warning Try to avoid using Microsoft.We first-person plural like 'We'. 56:120 suggestion Try to keep sentences short (< Microsoft.SentenceLength 30 words). 56:120 warning Use first person (such as Microsoft.FirstPerson 'I'm') sparingly. 59:15 warning Use first person (such as ' I Microsoft.FirstPerson ') sparingly. 59:94 suggestion Consider using 'idea' instead Microsoft.ComplexWords of 'concept'. 59:213 suggestion Consider using 'carry out' or Microsoft.ComplexWords 'do' instead of 'accomplish'. 59:240 suggestion Try to keep sentences short (< Microsoft.SentenceLength 30 words). 59:270 suggestion Consider using 'idea' instead Microsoft.ComplexWords of 'concept'. 59:354 error Use 'don't' instead of 'do Microsoft.Contractions not'. 100:22 suggestion Consider using 'many' instead Microsoft.ComplexWords of 'multiple'. 100:93 suggestion Consider using 'many' instead Microsoft.ComplexWords of 'multiple'. 100:231 warning Use first person (such as Microsoft.FirstPerson 'I'm') sparingly. 100:270 suggestion Try to keep sentences short (< Microsoft.SentenceLength 30 words). 100:270 warning Use first person (such as Microsoft.FirstPerson 'I'm') sparingly. 100:429 suggestion 'be analyzed' looks like Microsoft.Passive passive voice. 103:49 suggestion 'be called' looks like passive Microsoft.Passive voice. 103:64 suggestion Try to keep sentences short (< Microsoft.SentenceLength 30 words). 103:122 warning Use first person (such as Microsoft.FirstPerson 'my') sparingly. 103:140 warning Use first person (such as Microsoft.FirstPerson 'I'm') sparingly. 103:157 warning Consider removing 'terribly'. Microsoft.Adverbs 103:352 suggestion Consider using 'inside' Microsoft.ComplexWords or 'included' instead of 'enclosed'. 103:432 suggestion 'being created' looks like Microsoft.Passive passive voice. 103:492 warning Use first person (such as ' I Microsoft.FirstPerson ') sparingly. 103:650 suggestion Try to keep sentences short (< Microsoft.SentenceLength 30 words). 103:677 warning Consider using 'all' instead Microsoft.Wordiness of 'all of'. 103:704 suggestion 'be set' looks like passive Microsoft.Passive voice. 103:714 error Use 'they're' instead of 'they Microsoft.Contractions are'. 103:783 error Use 'what's' instead of 'what Microsoft.Contractions is'. 103:788 suggestion 'is chosen' looks like passive Microsoft.Passive voice. 103:801 suggestion 'be displayed' looks like Microsoft.Passive passive voice. 103:824 warning Use first person (such as ' I Microsoft.FirstPerson ') sparingly. 105:1 suggestion '******** of the Hidden Microsoft.Headings Temple' should use sentence-style capitalization. 106:119 warning Try to avoid using Microsoft.We first-person plural like 'We'. 106:188 warning Consider removing 'extremely'. Microsoft.Adverbs 106:382 warning Use first person (such as ' I Microsoft.FirstPerson ') sparingly. 106:482 warning Try to avoid using Microsoft.We first-person plural like 'we'. 106:504 warning Try to avoid using Microsoft.We first-person plural like 'we'. 106:544 suggestion 'being plotted' looks like Microsoft.Passive passive voice. 106:570 suggestion 'be plotted' looks like Microsoft.Passive passive voice. 137:5 suggestion Try to keep sentences short (< Microsoft.SentenceLength 30 words). 139:20 warning Consider removing 'really'. Microsoft.Adverbs 139:201 suggestion 'be imparted' looks like Microsoft.Passive passive voice. 139:360 warning Try to avoid using Microsoft.We first-person plural like 'we'. 139:464 warning Try to avoid using Microsoft.We first-person plural like 'We'. 139:537 error Use 'they're' instead of 'they Microsoft.Contractions are'. 141:25 warning Try to avoid using Microsoft.We first-person plural like 'we'. 142:185 warning Try to avoid using Microsoft.We first-person plural like 'let's'. 206:1 warning Use first person (such as 'I Microsoft.FirstPerson ') sparingly. 206:39 warning Use first person (such as Microsoft.FirstPerson 'me') sparingly. 206:157 suggestion Try to keep sentences short (< Microsoft.SentenceLength 30 words). 206:167 suggestion 'being passed' looks like Microsoft.Passive passive voice. 206:230 error Use 'wasn't' instead of 'was Microsoft.Contractions not'. 206:241 warning Use first person (such as ' I Microsoft.FirstPerson ') sparingly. 208:1 suggestion Try to keep sentences short (< Microsoft.SentenceLength 30 words). 208:1 warning Try to avoid using Microsoft.We first-person plural like 'We'. 208:40 warning Try to avoid using Microsoft.We first-person plural like 'we'. 208:183 suggestion Try to keep sentences short (< Microsoft.SentenceLength 30 words). 208:210 warning Try to avoid using Microsoft.We first-person plural like 'our'. 208:229 warning Try to avoid using Microsoft.We first-person plural like 'we'. 208:454 warning Try to avoid using Microsoft.We first-person plural like 'we'. 208:454 error Use 'we're' instead of 'we Microsoft.Contractions are'. 208:470 warning Try to avoid using Microsoft.We first-person plural like 'our'. 208:517 warning Try to avoid using Microsoft.We first-person plural like 'We'. 208:624 suggestion Try to keep sentences short (< Microsoft.SentenceLength 30 words). 210:21 warning Don't use end punctuation in Microsoft.HeadingPunctuation headings. 211:57 warning Try to avoid using Microsoft.We first-person plural like 'we'. 211:225 warning Try to avoid using Microsoft.We first-person plural like 'We'. 211:232 warning Consider removing 'readily'. Microsoft.Adverbs 211:276 warning Try to avoid using Microsoft.We first-person plural like 'our'. 211:307 warning Use first person (such as ' I Microsoft.FirstPerson ') sparingly. 211:326 warning Use first person (such as Microsoft.FirstPerson 'me') sparingly. 265:5 suggestion Try to keep sentences short (< Microsoft.SentenceLength 30 words). 267:40 warning Use first person (such as Microsoft.FirstPerson 'I'm') sparingly. 267:44 warning Consider removing 'honestly'. Microsoft.Adverbs 267:168 suggestion Consider using 'idea' instead Microsoft.ComplexWords of 'concept'. 267:220 warning Consider removing 'very'. Microsoft.Adverbs 267:503 warning Consider using 'all' instead Microsoft.Wordiness of 'all of'. 267:574 warning Try to avoid using Microsoft.We first-person plural like 'we'. 267:648 error Use 'isn't' instead of 'is Microsoft.Contractions not'. 267:669 warning Try to avoid using Microsoft.We first-person plural like 'we'. 267:788 warning Consider removing Microsoft.Adverbs 'potentially'. 267:827 suggestion 'be refactored' looks like Microsoft.Passive passive voice. 270:153 warning Try to avoid using Microsoft.We first-person plural like 'We'. 270:180 warning Try to avoid using Microsoft.We first-person plural like 'our'. 270:214 warning Use first person (such as Microsoft.FirstPerson 'my') sparingly. 270:255 warning Use first person (such as Microsoft.FirstPerson 'I'm') sparingly. 270:331 warning Try to avoid using Microsoft.We first-person plural like 'we'. 270:342 error Use 'that's' instead of 'that Microsoft.Contractions is'. 270:449 warning Try to avoid using Microsoft.We first-person plural like 'we'. 272:40 suggestion 'was checked' looks like Microsoft.Passive passive voice. 272:146 suggestion 'was checked' looks like Microsoft.Passive passive voice. 272:184 suggestion Verify your use of 'as well Microsoft.Vocab as' with the A-Z word list. 272:210 warning Use first person (such as ' I Microsoft.FirstPerson ') sparingly. 272:284 suggestion 'was put' looks like passive Microsoft.Passive voice.✖ 9 errors, 65 warnings and 38 suggestions in 1 file.